
Case study, OClair Environnement · Since 2021
COVID-19 tracked in wastewater, on a single platform
CETO, OClair Environnement's epidemiological platform, tracks COVID-19 in wastewater, from field sampling all the way to public health recommendations.
- Application web
- Application mobile
- Gestion des données
- Ingénierie logicielle
- Design UI/UX
- 2022 OCTAS Award
- Distinction
- 5 to 7 days
- Of warning before an outbreak
- Web and mobile
- From the field to the lab
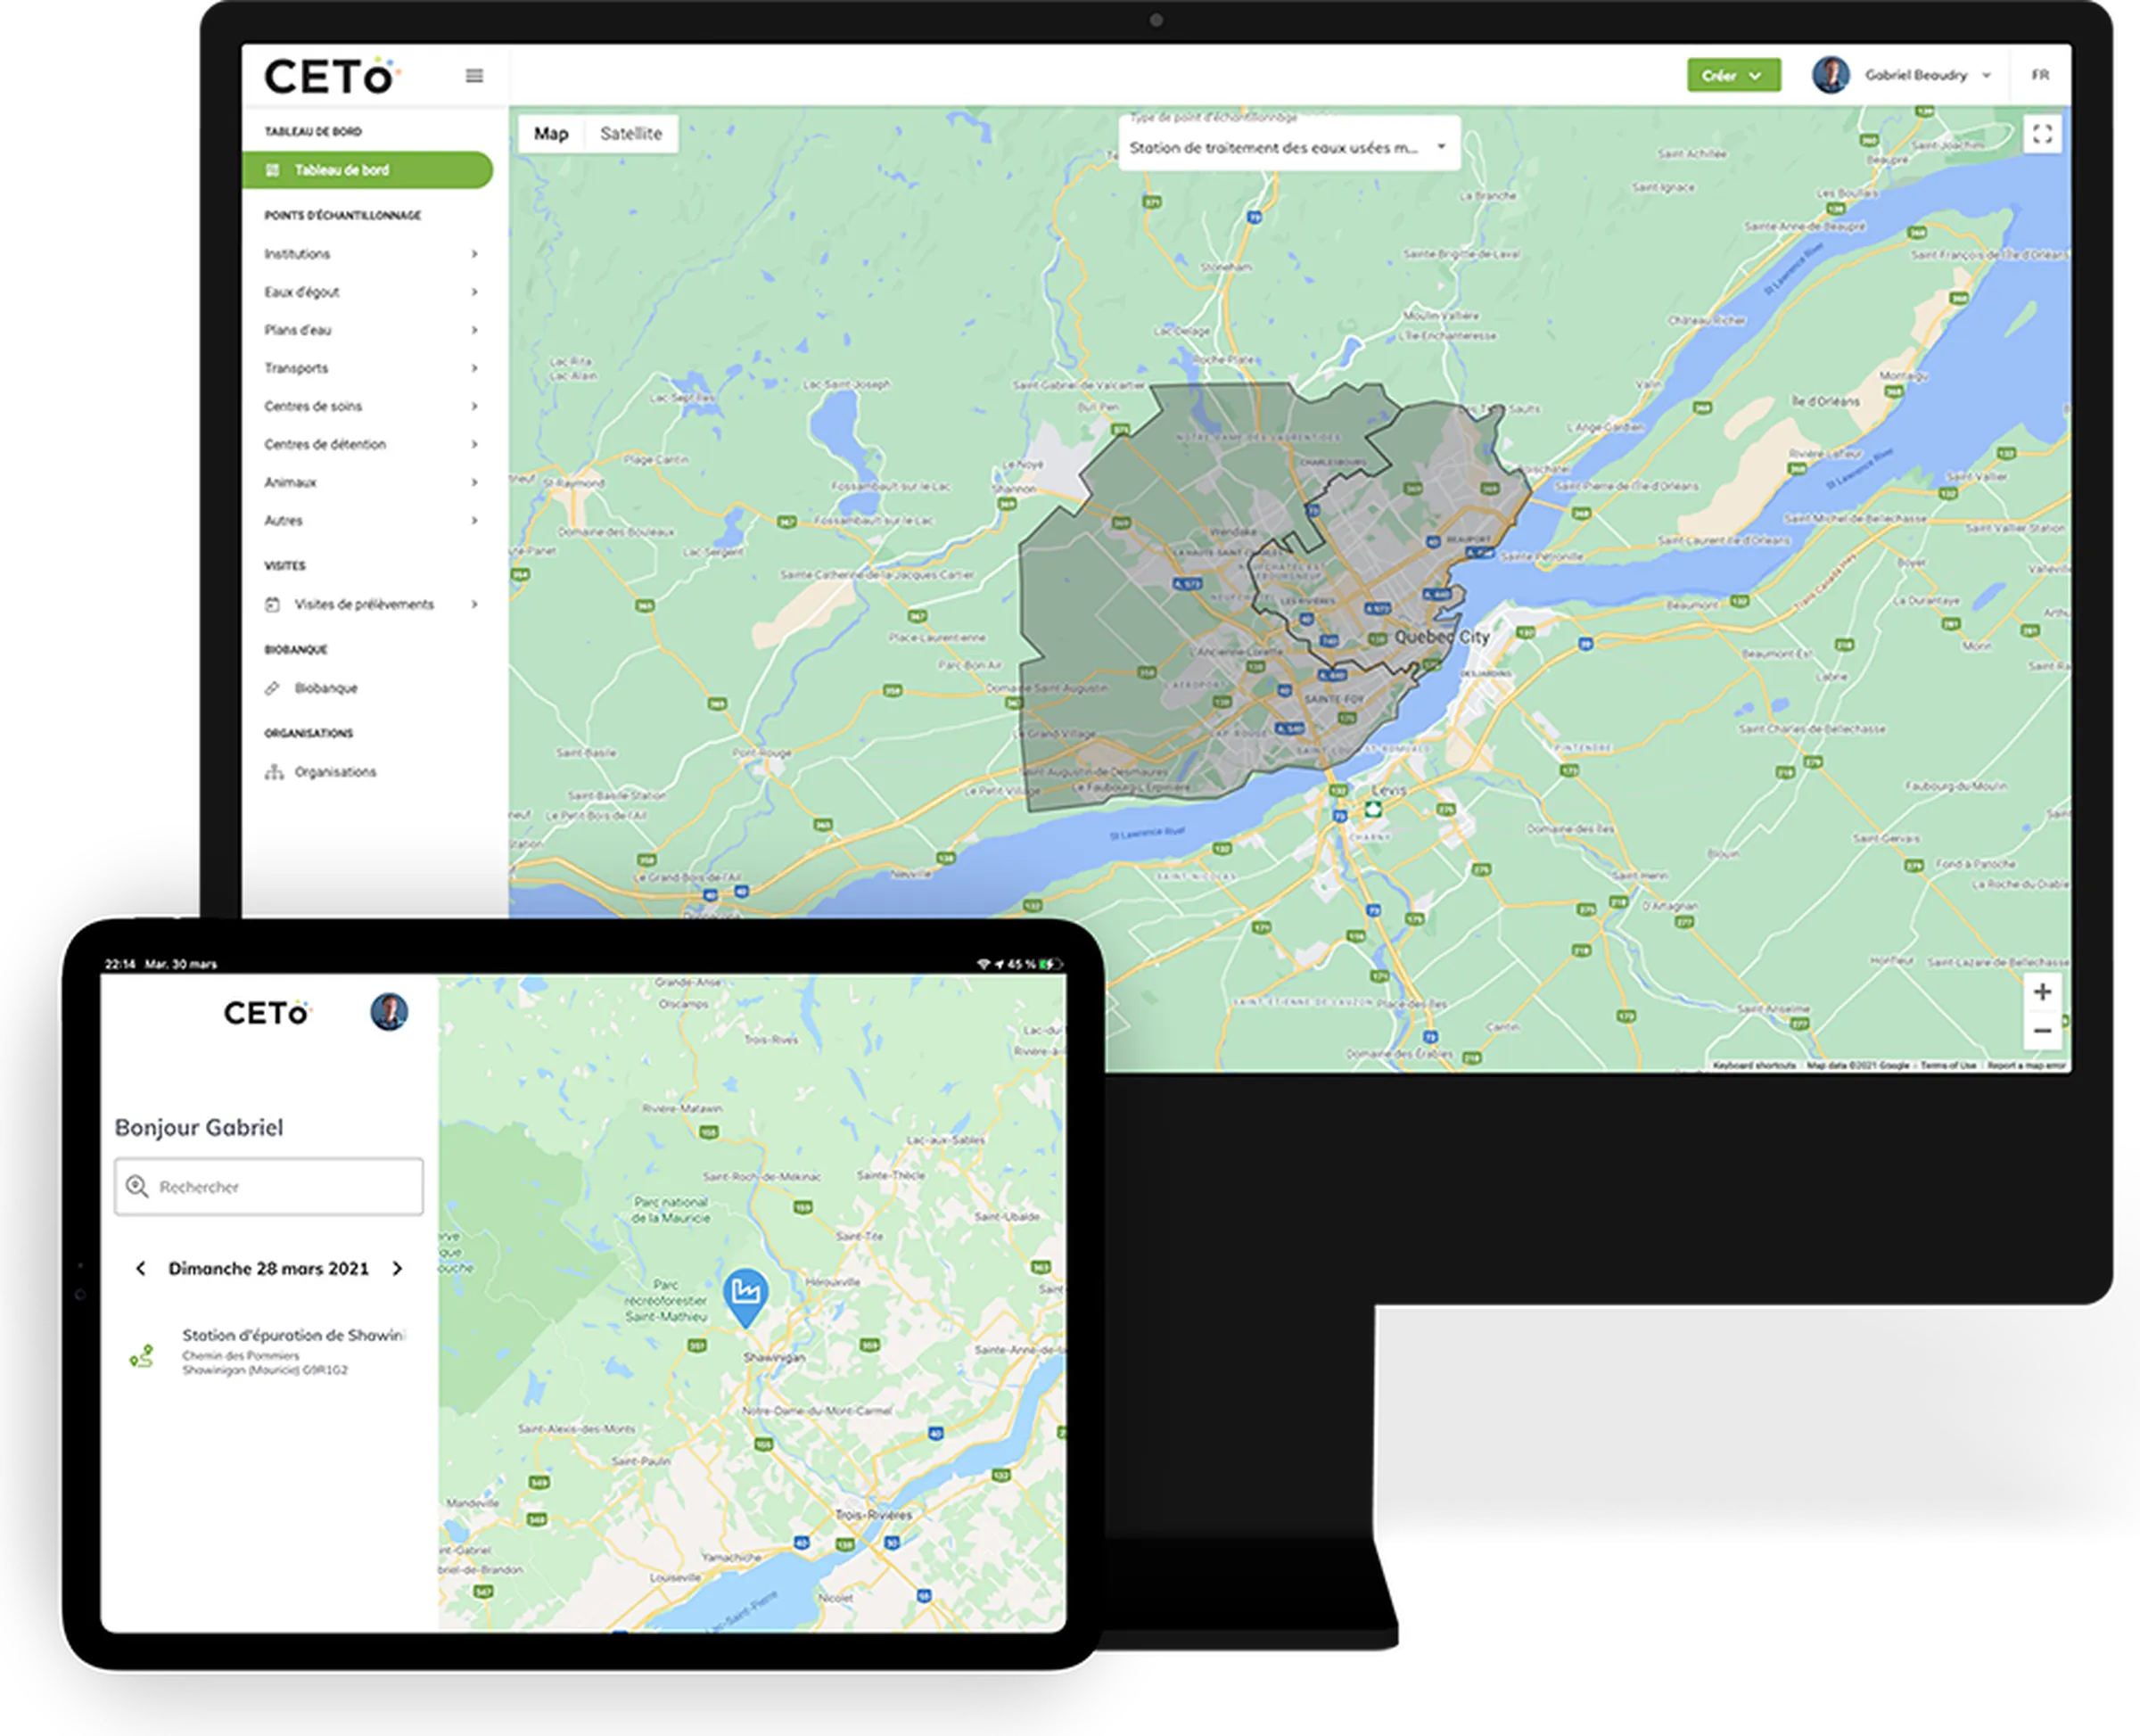
01The context
Sample data with no shared home.
OClair Environnement, a company from Lanaudière, works to protect public health and the environment. It develops software tools that simplify the work of people managing water and contaminants. Recursyve has been building the Nerri platform with it since 2017.
During the COVID-19 pandemic, OClair teamed up with the CentrEau university research group and a private consortium with one goal: detect COVID-19 in wastewater and visualize the data in the best possible way. But when sampling, researchers had no shared place to enter their data and then share it with government authorities. Communication suffered and time was lost.
02What we were asked to do
Three goals, one step ahead.
For researchers, a single place to enter data. For public health, clear trends to act in time.
- 01
Centralize everything
Every stakeholder's samples and lab results, in the same place.
- 02
Trace every sample
One QR code per sample, from the field to the lab, to make sure the cold chain is respected.
- 03
Anticipate outbreaks
Trends by sector to help public health and the authorities decide sooner.
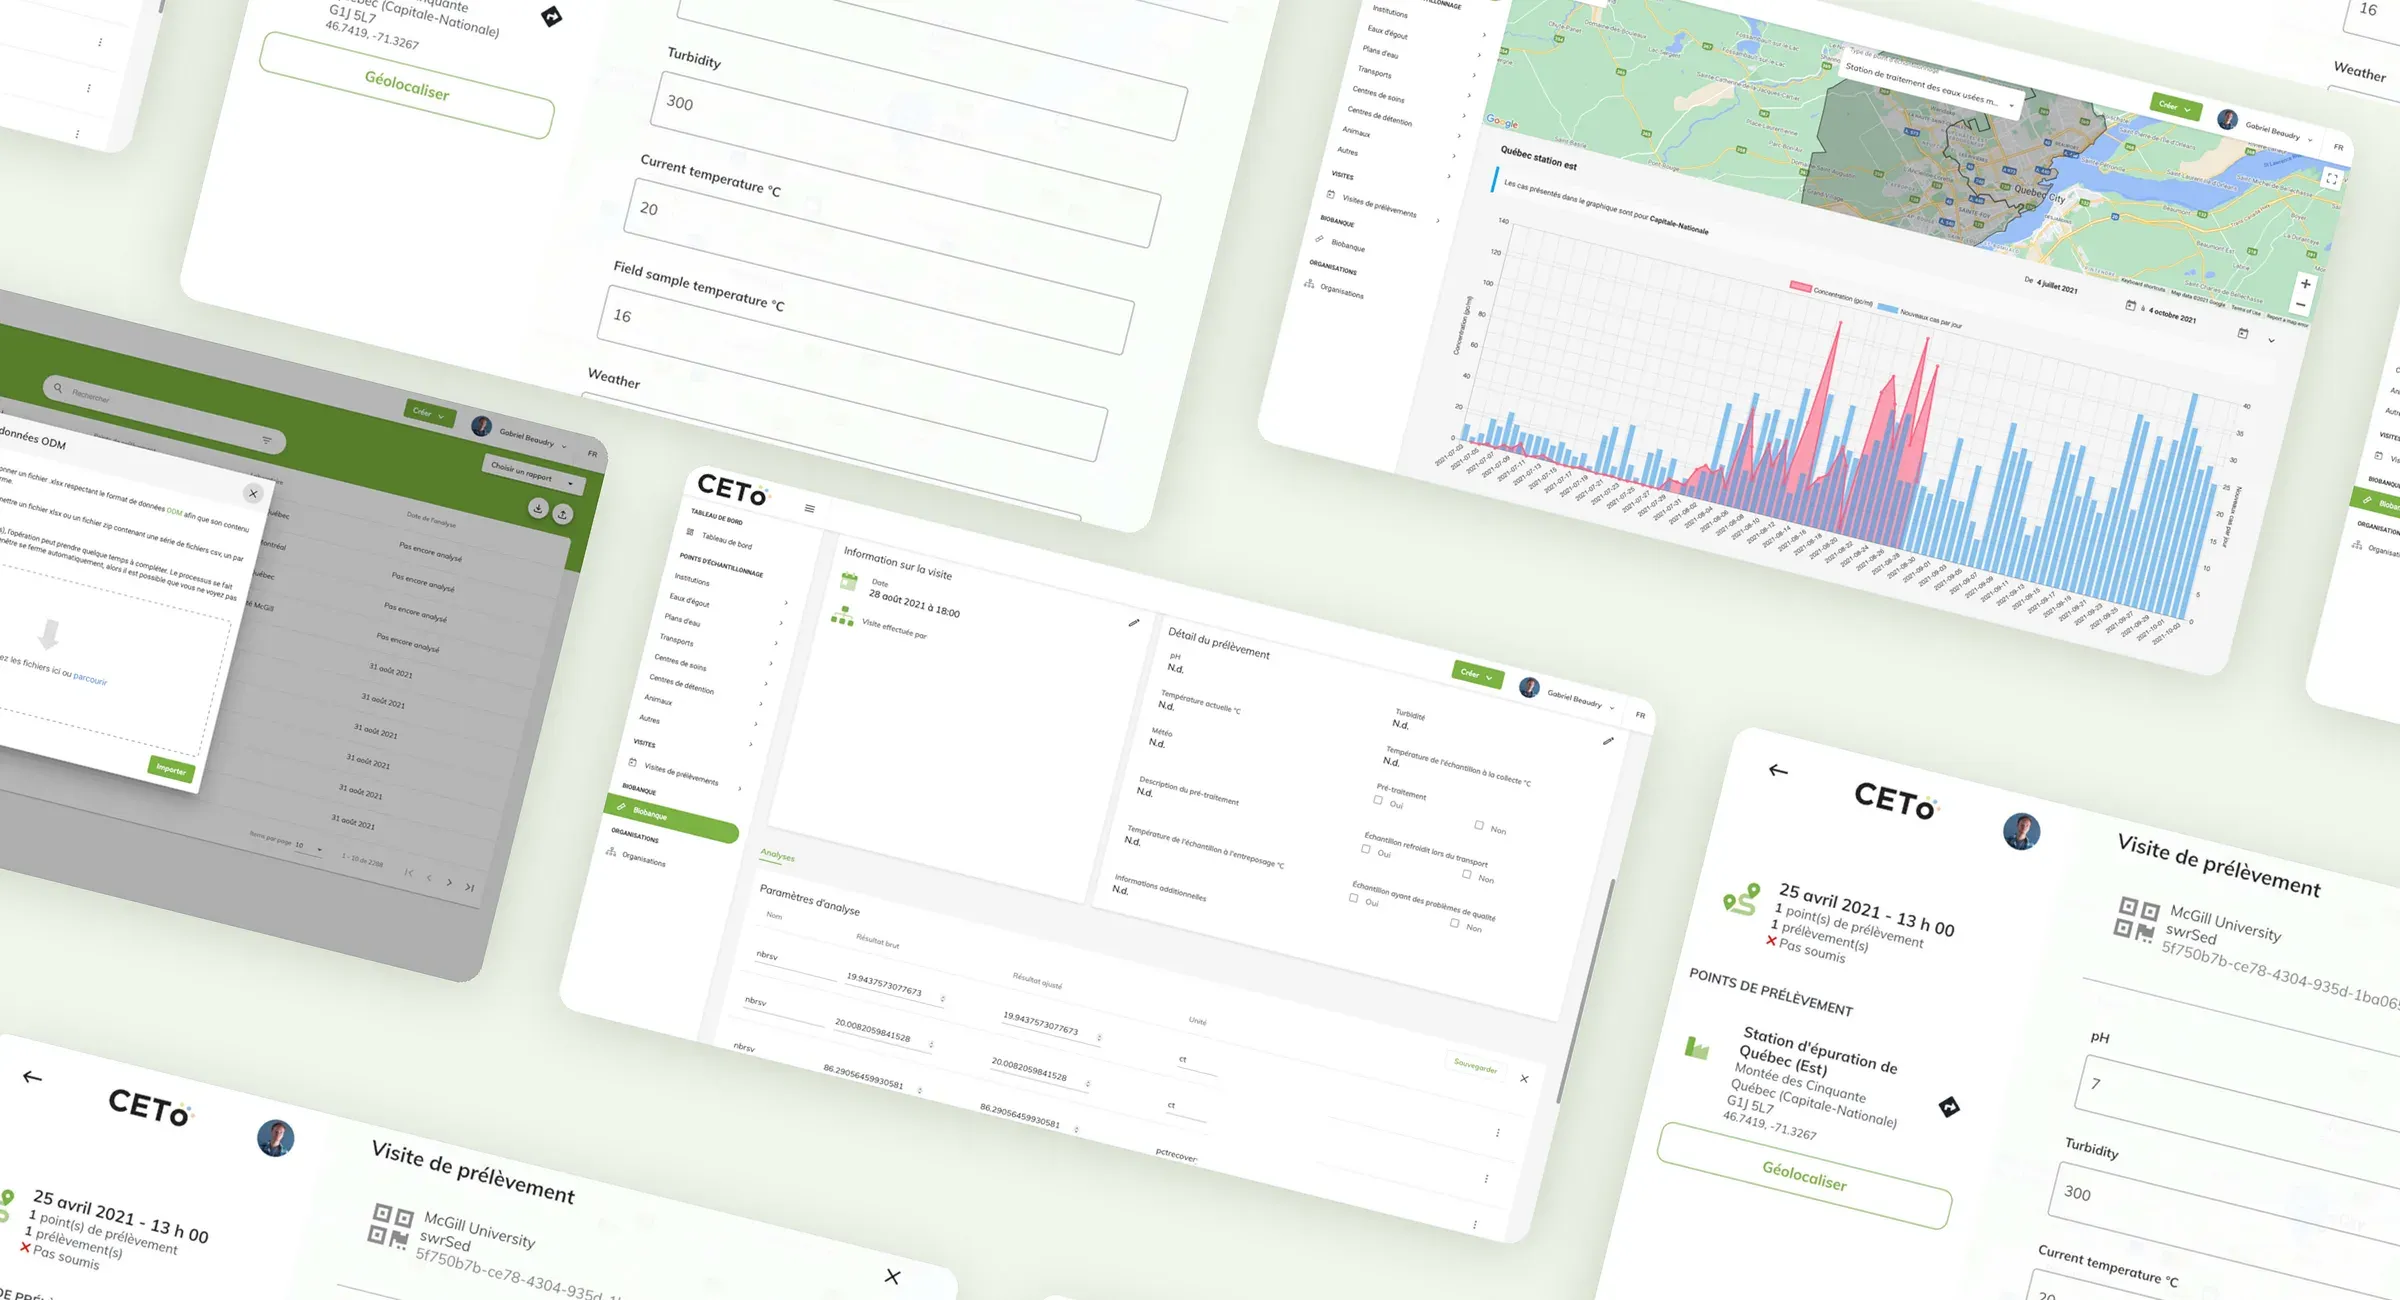
03The solution
One platform, from sampling to decision.
Technicians and labs enter the data. Public health and the authorities read it by sector.
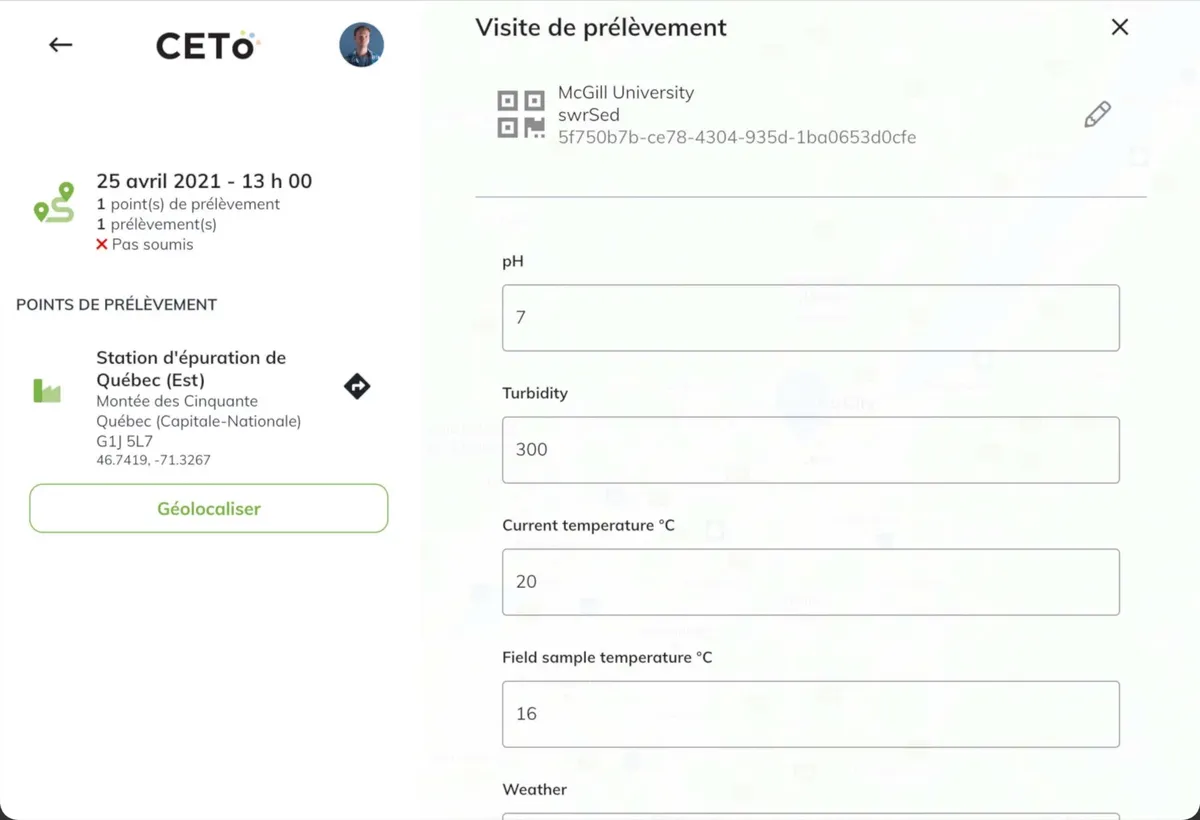
In the field
The technician follows the route
The day's sampling visits, the points to visit and every new sample entered on a tablet, with its QR code.
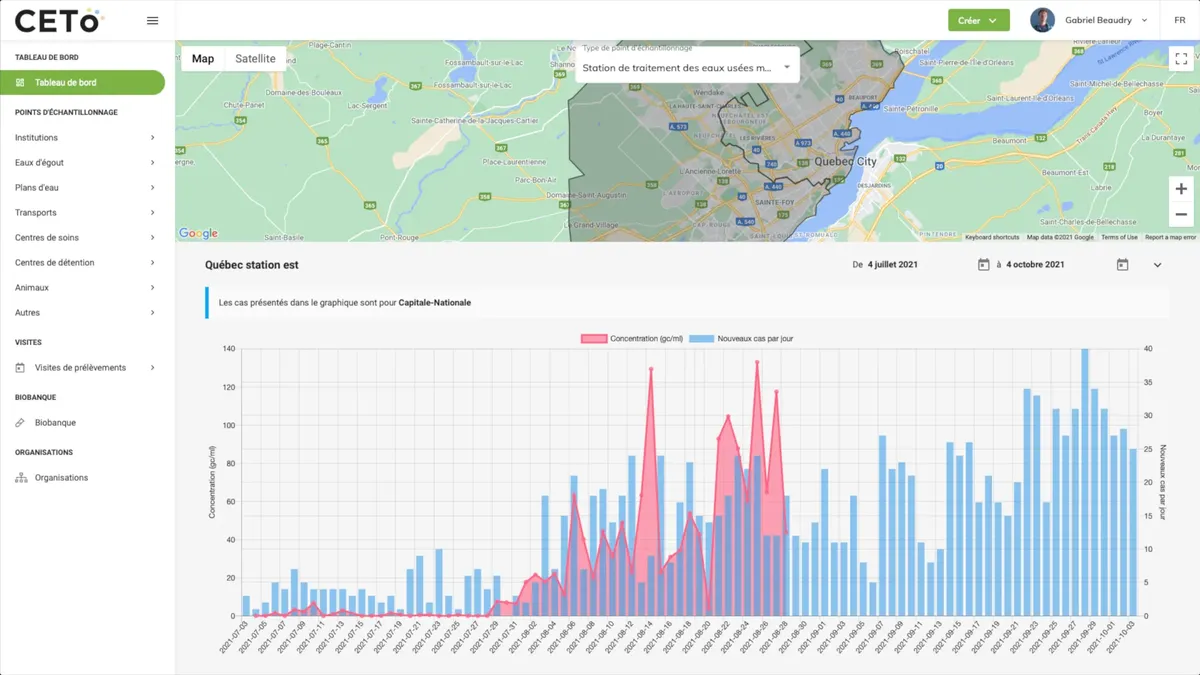
For public health
The authorities see it coming
The virus concentration in each sector, compared with new daily cases, to make decisions and anticipate outbreaks.
04The modules
From sampling all the way to the trend.
A web platform for labs and authorities, a mobile app for technicians.
01 / 07 · Sampling points
Every source,
on the map.
Results come from wastewater, nasal swabs, saliva tests, surfaces and animal samples, each linked to its sampling point.
02 / 07 · Sample tracking
One QR code,
to the lab.
In the mobile app, technicians enter each new sample with its QR code. At the lab, the code traces its history and confirms the cold chain was respected.
03 / 07 · Lab analyses
At the lab,
virus measured.
Once samples are collected, the analysis results are entered, especially the virus concentration in the sample.
04 / 07 · Aliquots and pooled samples
Split, pooled,
never lost.
The biobank then manages aliquots and pooled samples, each linked to its original sample.
05 / 07 · Trends by sector
Virus rising,
and we see it.
Charts show the rise or fall of the virus over time for each sector and compare it with new daily cases to confirm the results.
06 / 07 · Recommendations by zone
Every zone,
its guidance.
Based on the results, public health and government recommendations and actions are set according to the needs of the targeted zone.
07 / 07 · Data import
A spreadsheet,
all imported.
Data is imported from a spreadsheet in a format recognized in North America and Europe, making it easy to bring in a new client's database.
05The technology
Three apps, one single source.
- Angular

- NestJS

- Flutter

- Google Maps

- MySQL

- MongoDB

- Firebase

- Google Cloud

- Google Analytics

- Auth0

- Sentry

- Tailwind CSS

The dashboard for labs and authorities, the technicians' mobile app and the server all share the same data.
Angular: the web dashboard, the sector map and the charts.
NestJS: the server, which receives and imports the data.
Flutter: the technicians' mobile app, on tablets.
Google Maps: sectors and sampling points on the map.
06The results
What it changes for public health.
Outbreaks detected 5 to 7 days in advance.
CETO's charts help public health and government authorities make decisions and anticipate outbreaks.
Better communication between stakeholders
More efficient deployment of resources
Outbreaks prevented and a protected population
A strong business attitude and a strong team, both good signs of future success. I wouldn't hesitate for a second to warmly recommend Recursyve's services.
Translated from French.
An idea in mind?
Let’s chat!